Do you feel overwhelmed by the seemingly impossible task of averting the approaching climate crisis?
I usually do. Modern humans (or at least Americans) are addicted to their F-150’s, filet mignon, and flights abroad. Relying on individual restraint will not solve global warming.
Our best chance is for governments to step in and steer us toward a carbon-free future. But where to start?
This is where an intuitive climate simulator called En-ROADS comes into play. Created by Climate Interactive and MIT Sloan’s Sustainability Initiative, this tool allows a user to effectively create their own policy solution to climate change.
Where are these numbers coming from?
Of course, it’s not that simple. Under the hood, the simulator is running nearly 14,000 equations over 110 years from 1990 to 2100 in just 60 milliseconds. These equations rely on factors such as delay times, progress ratios, price sensitivities, historic growth of energy sources, and energy efficiency potential culled from the literature.
If you’re interested in more of the science and math behind the simulation, the En-ROADS team has documented all their assumptions, parameters, and equations in a reference guide that runs nearly 400 pages long. Climate Interactive’s docs offer a more digestible read that also includes a “Big Message” takeaway for each of the levers.
Let’s start building our climate-friendly world
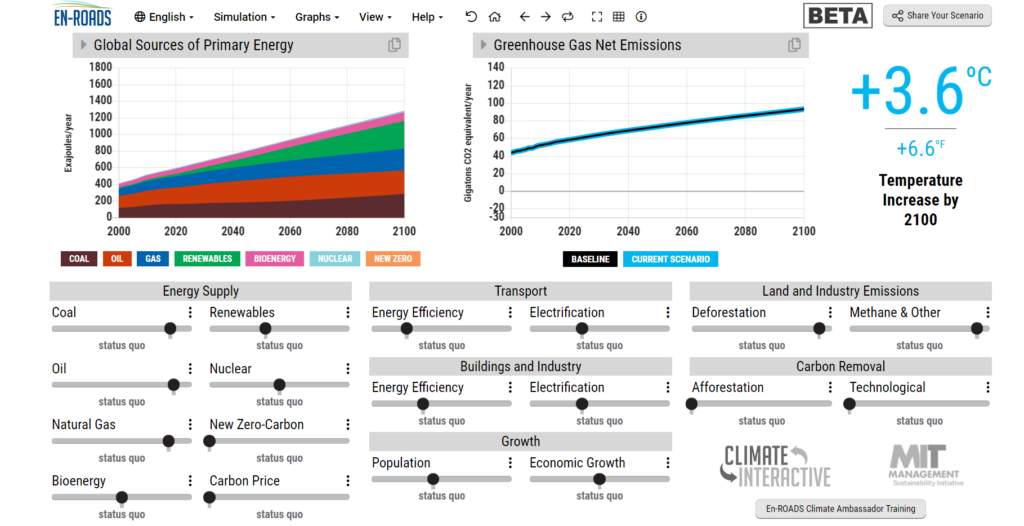
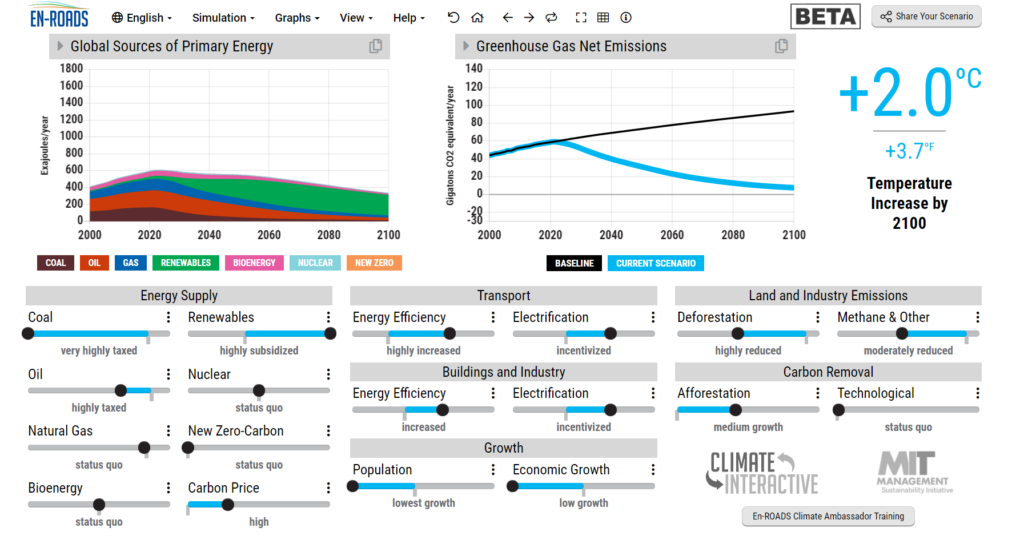
The interface looks like the screenshot below, which shows the starting scenario. This is “business-as-usual”, leading us to an increase of 3.6°C by the year 2100. We see from the colorful plot on the left that the model already predicts a rise in renewable energy by that time—however it looks like the additional renewables go directly to powering a more energy-intensive society as the exojoules expected from other energy sources are roughly constant.
Let’s try to avert this disaster. Coal seems like an easy place to start. We’ll tax it to the max ($110 per ton).
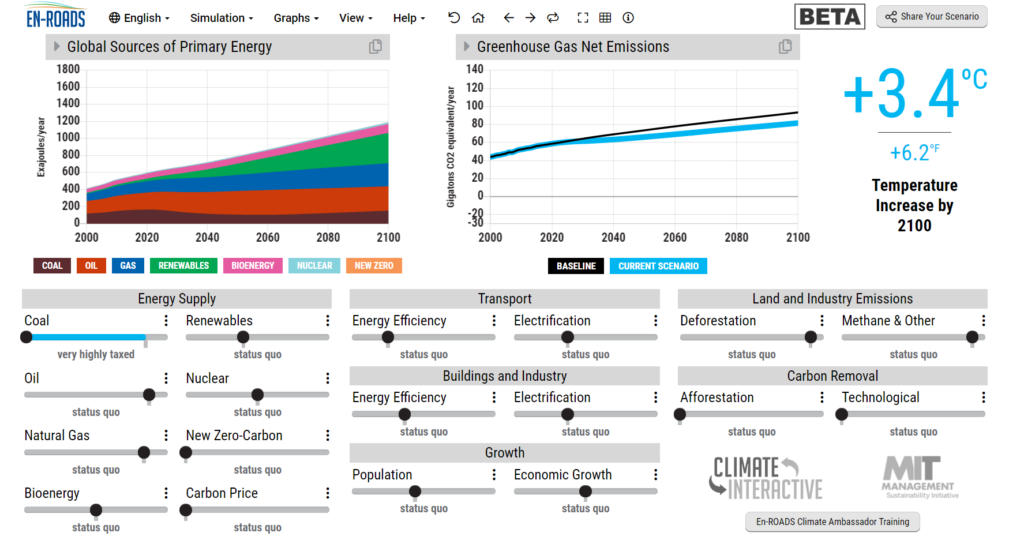
Temperature increase is now at 3.4°C. Not exactly the big boost we were hoping for.
I spent some time playing around with the simulator to limit our warming to 2°C, which is often cited as the threshold before catastrophe. I tried to implement policies that I thought might be politically feasible in the United States. Ones that either retooled existing jobs (electric cars vs. conventional ones) or created new business without disrupting existing ones (increased energy efficiency in buildings).
My main takeaways from the simulation:
Carbon price of $70 per ton → 0.5°C temperature reduction
Implementing a carbon price resulted in the biggest bang for our buck.
The carbon impact of an economy flight from NYC to LA is a half ton of CO2, which I used as a quick benchmark to set a carbon price that didn’t send me into sticker shock. I considered an additional charge of $35 for that flight to be a fee I could swallow, a price En-ROADS labeled “high”.
Note that the simulator also allows you to choose the timeline for this carbon tax to phase in. The default was 10 years to reach the final price, which I did not change.
Population of 9.1 billion in 2100 → 0.1°C temperature reduction
I set population all the way to the left, which corresponds to the lower bound on the 95% probability range from the UN. Considering that not having children is the most environmental choice you can make, I expected a bigger boost from fewer people on the planet.
I suspect the reason behind such a small decrease in warming is that UN model assumes that depressed population growth would come from women’s empowerment campaigns in developing countries, which do not account for the lion’s share of emissions.
Growth of 0.5% GDP/year → 0.1°C temperature reduction
Given the emphasis on moving to a circular economy and away from a growth mindset, I figured limiting our economic growth would result in a sizable reduction in warming.
Wrong.
Granted, the model allows 75 years to achieve this lower GDP growth rate from the current rate of 2.5% GDP growth but a sacrifice of 1% GDP growth in exchange for just 0.1°C in temperature reduction seems like a waste of political capital.
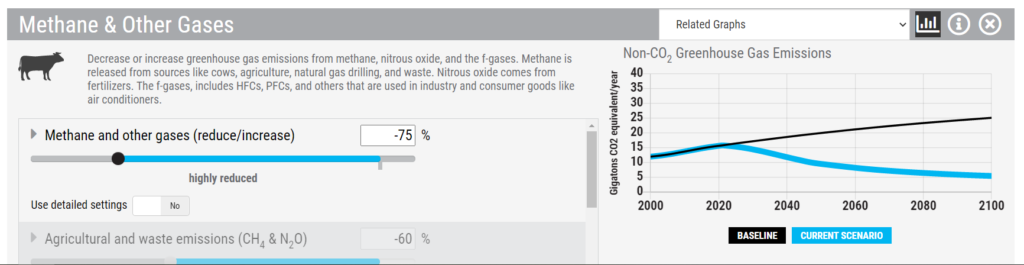
Methane reduction of 75% → 0.3°C temperature reduction
Methane is low-hanging fruit. While the simulator allows us to also limit emissions from certain industries as shown below (agriculture, mining, etc.), I set my reduction as 75% across the board. This would require a more plant-based diet for all, as well as increased accountability within heavy industry to reduce methane emissions.
Other actions taken to limit warming to 2°C included a reduction in deforestation with an increase in afforestation, as well as a modest subsidy for renewable energy. Notably, I did not pull the lever on technological carbon removal, although it’s an easy win to reduce warming. Those technologies have not been proven out, and I don’t believe we can count on them to swoop in and save the day.
My final world is one in which we’ve electrified our homes and transit, phased out coal, aggressively plugged methane emissions, and protected and planted forests. Of course, these initiatives are not simple—electrifying and retrofitting every home in America sounds daunting at best.
But it’s not impossible. From 1968 to 1976, The UK converted every single gas appliance in the country from town gas to natural gas. Just eight years to accomplish what some called “the greatest peacetime operation in the nation’s history”.
Where there’s a will, there’s a way.
Data visualization for social change
But perhaps a more immediate takeaway from the En-ROADS simulation is the experience of using the simulator itself. By distilling the giant thorny problem of climate change into a tangible set of levers, the tool allows stakeholders (humans like us) to grasp the problem and its potential solutions. It offers the ability to drill into a section if we want to understand the technical nitty-gritty but doesn’t overwhelm the user with detail at first glance.
It’s a powerful example of how investing in intuitive data visualization and ceding power to data consumers multiplies the impact of your work.
Of course, the tool isn’t perfect. Specifically, the UI after drilling into a lever doesn’t fill the screen and leads to an awkward user experience. But democratizing access to this kind of scientific literature in a way that a non-technical audience can appreciate is perhaps one of the most important ways to tackle misinformation and overcome apathy.
Tackling climate change is possible. We just need to know where to start.